September 19, 2025
Introduction
Some beer bottles are brown and some are green. But did you know that they also differ in shape? Even though it is not its primary purpose, a bottle works as a whistle. If you blow really hard, it emits a second, higher tone. These tones occur at the resonance frequencies of the bottle. In this blog post, we measure and compare the resonance frequencies of two different bottles. I am using ACME to perform and process the measurements.
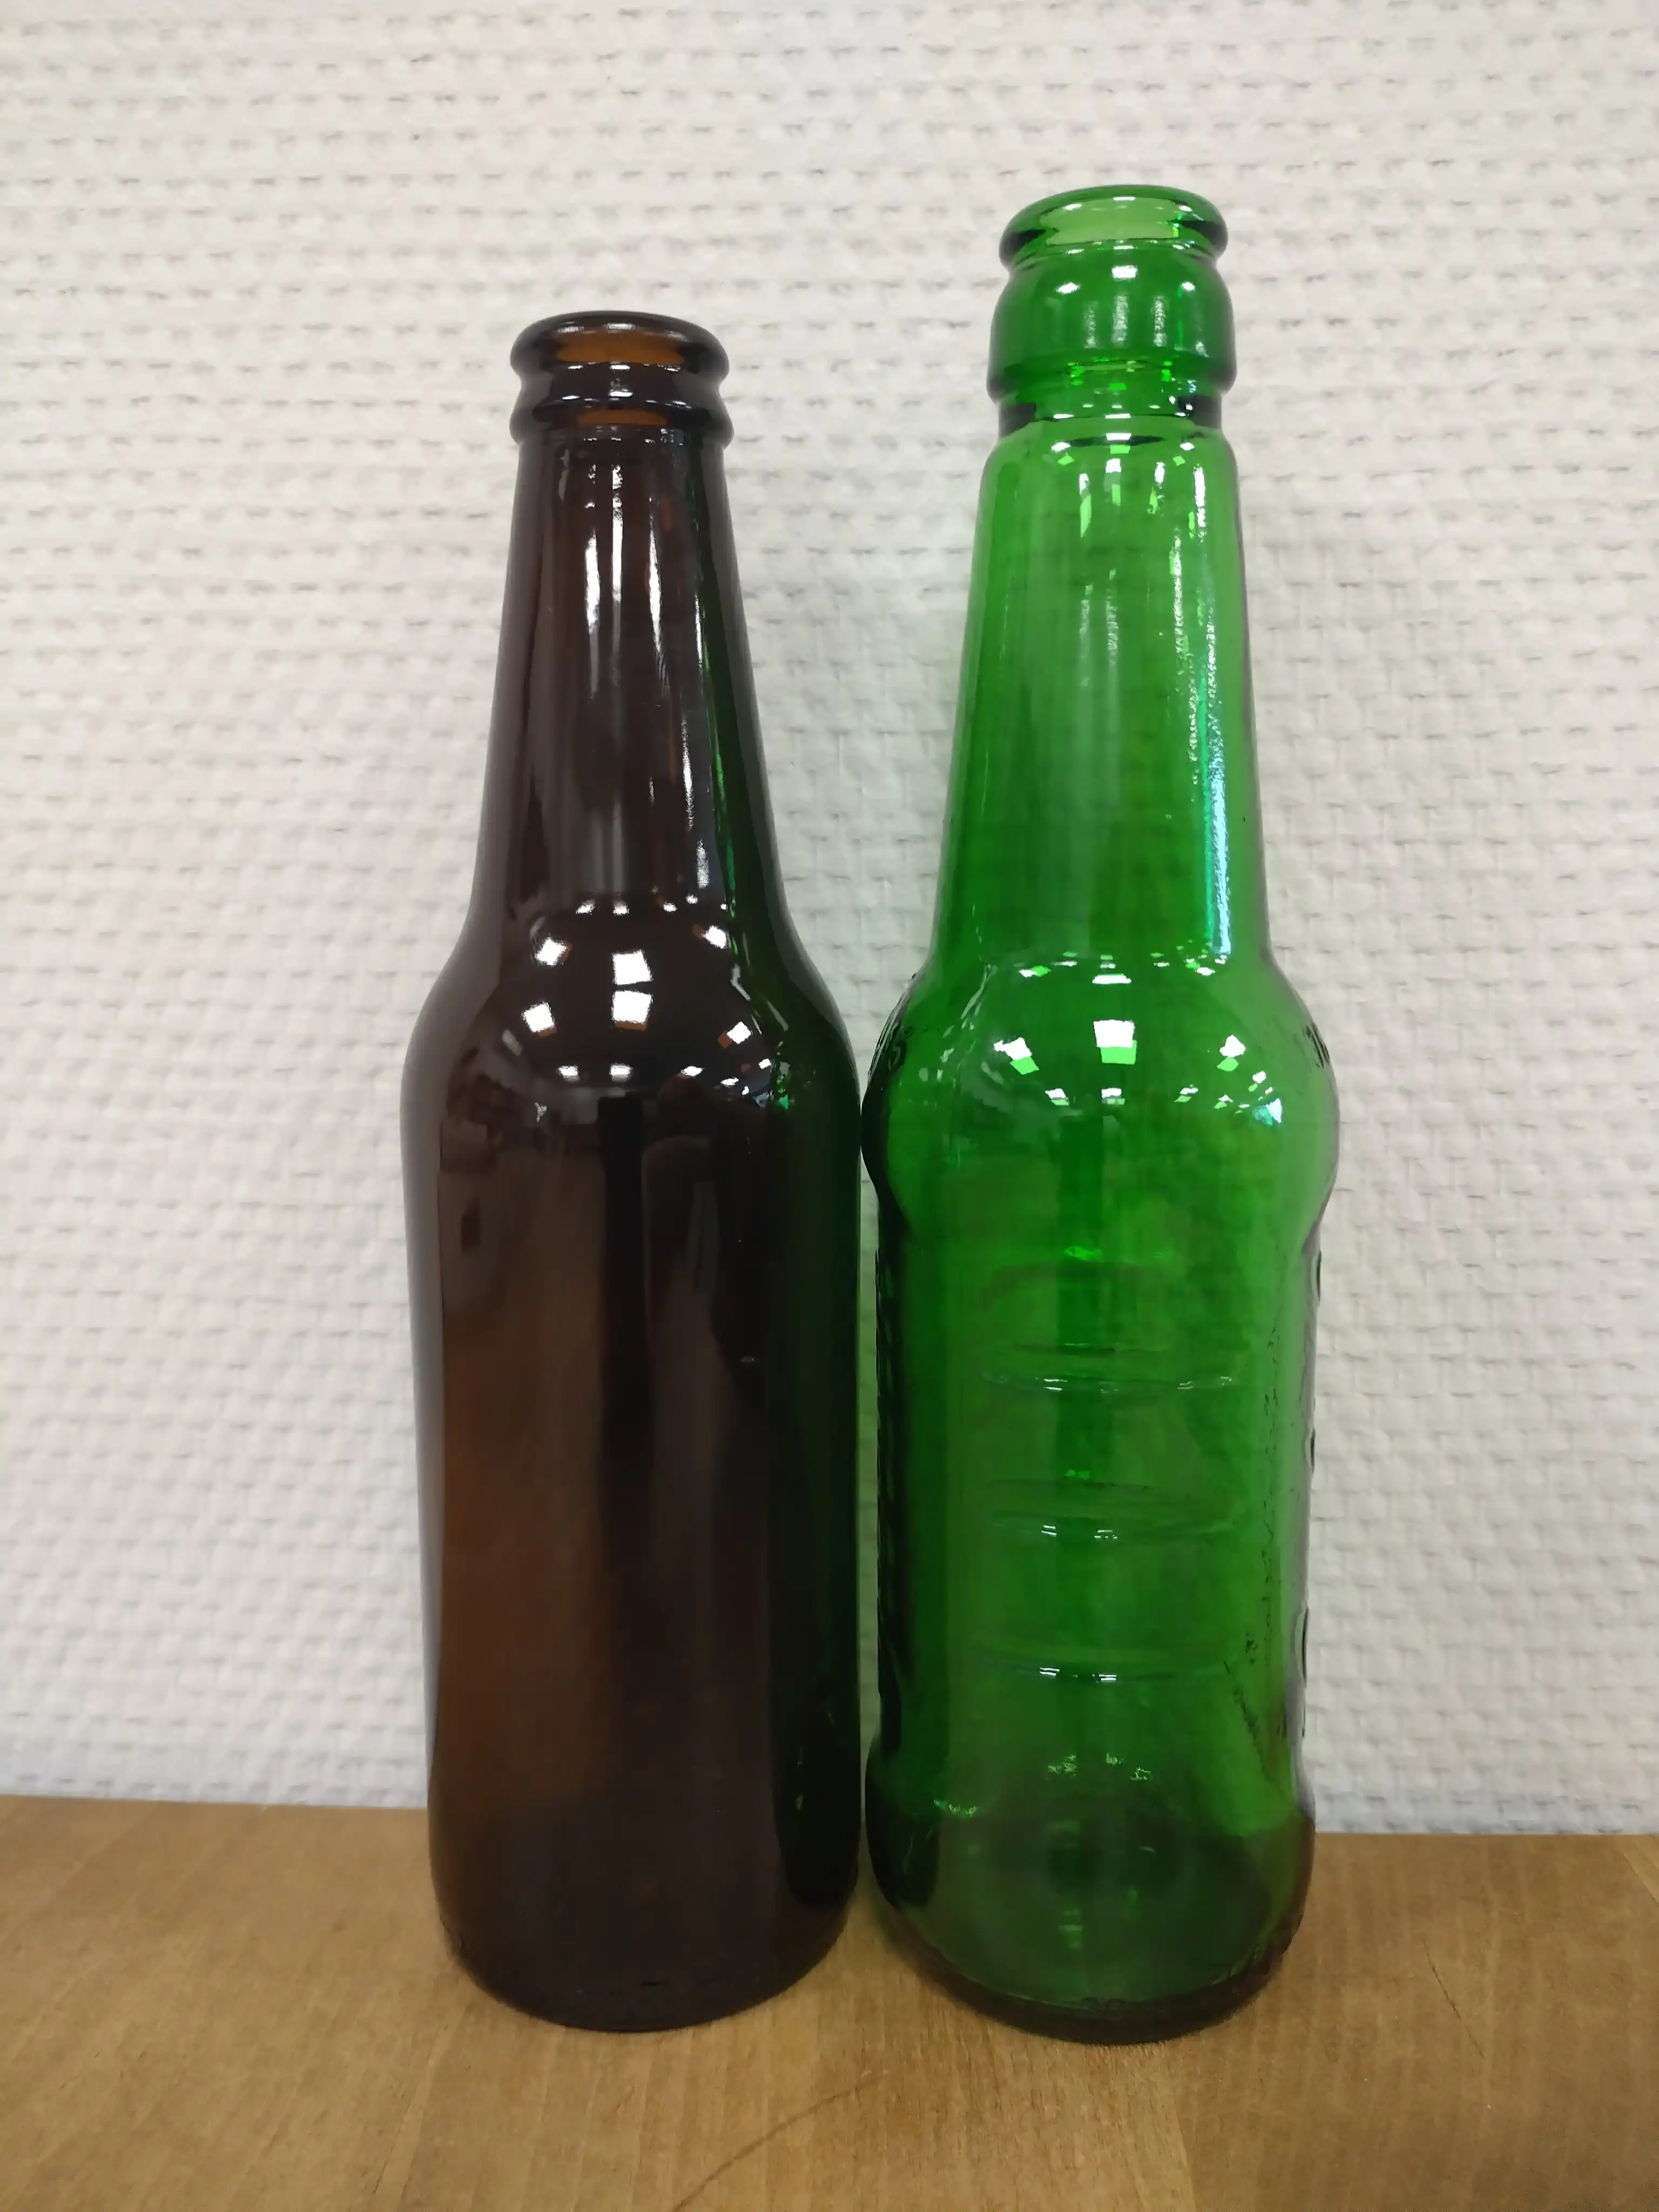
Meet the contenders:
The contenders
On the left we have a responsible 0.0 % brown bottle with a classic shape. It measures 20.7 cm in height and weighs 253 g. Standing proudly on the right, the green bottle is 21.9 cm tall, yet is lighter at 245 g. Both bottles are designed to hold 300 mL of beer. If the bottler would be really generous and fill the bottles to the brim, each could hold 315 mL.
Measurement setup
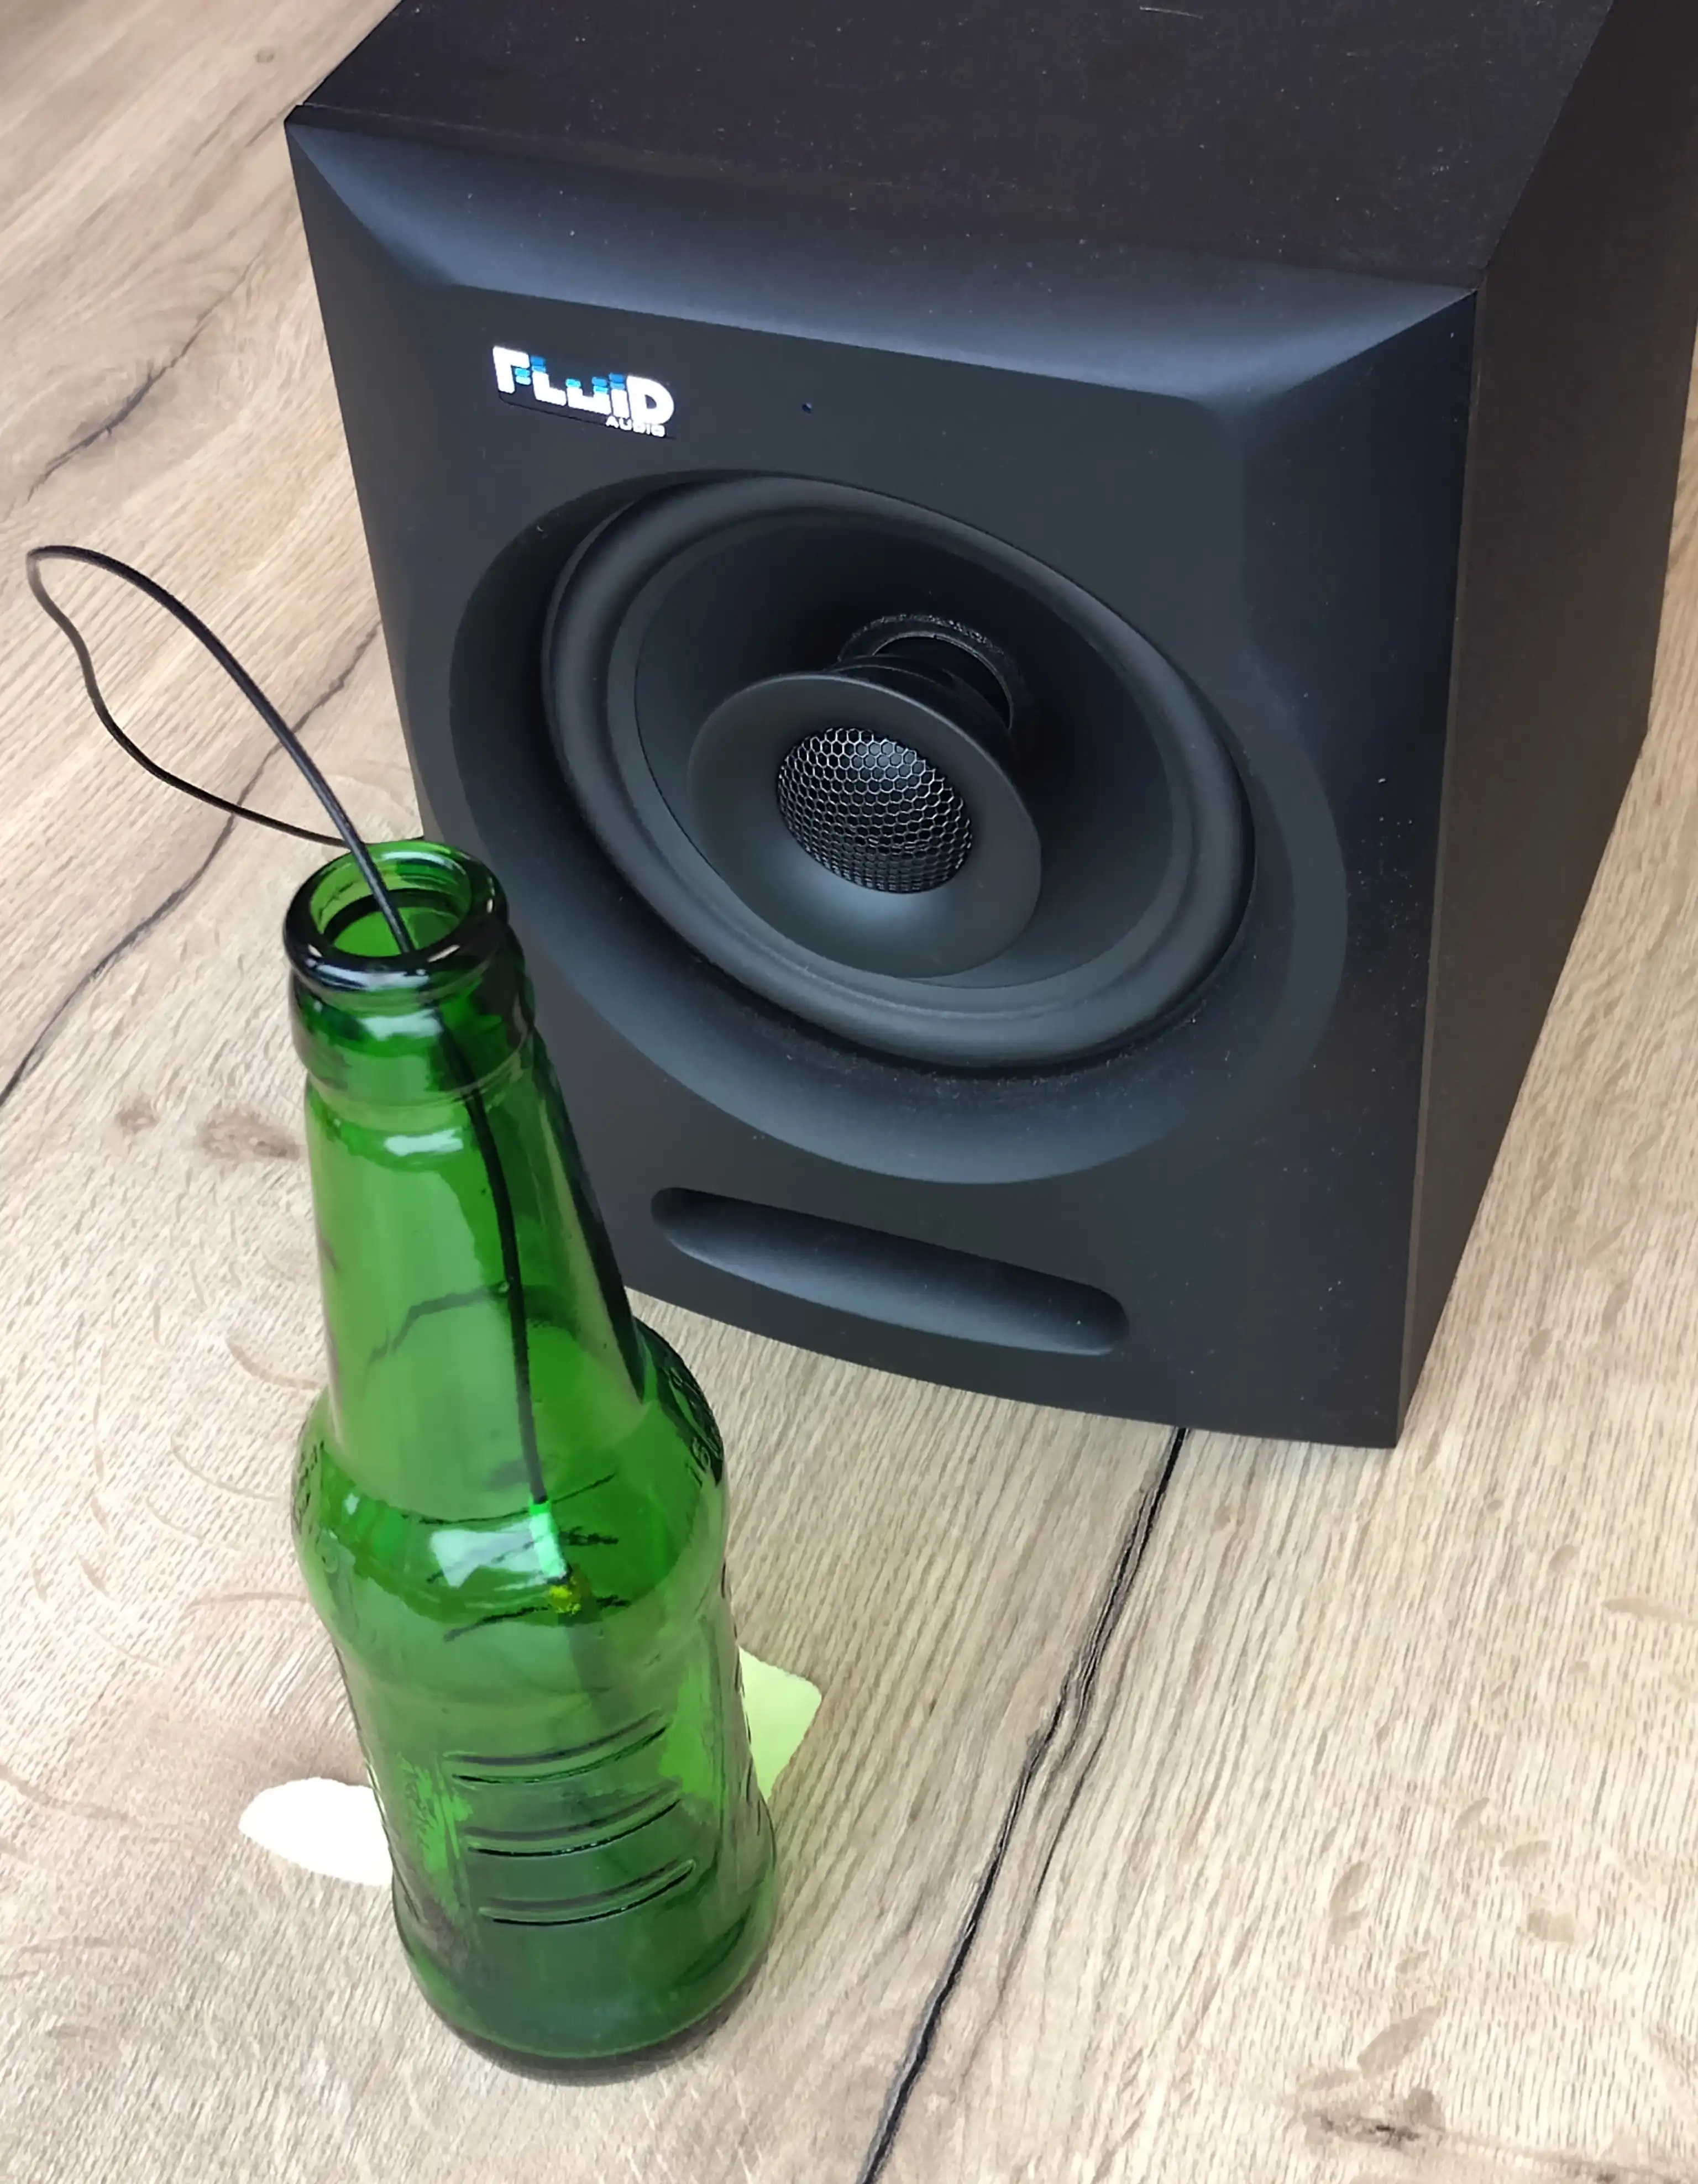
When whistling on a bottle, the air inside the bottle neck vibrates up and down, while the air pressure in the belly drops and rises. Most microphones respond to pressure and ours is no exception, so I stuck a slender 1/4" diameter microphone inside the bottle belly and placed it near the bottom. A loudspeaker located a small distance away provides pink noise.
Measurement setup: microphone inside bottle
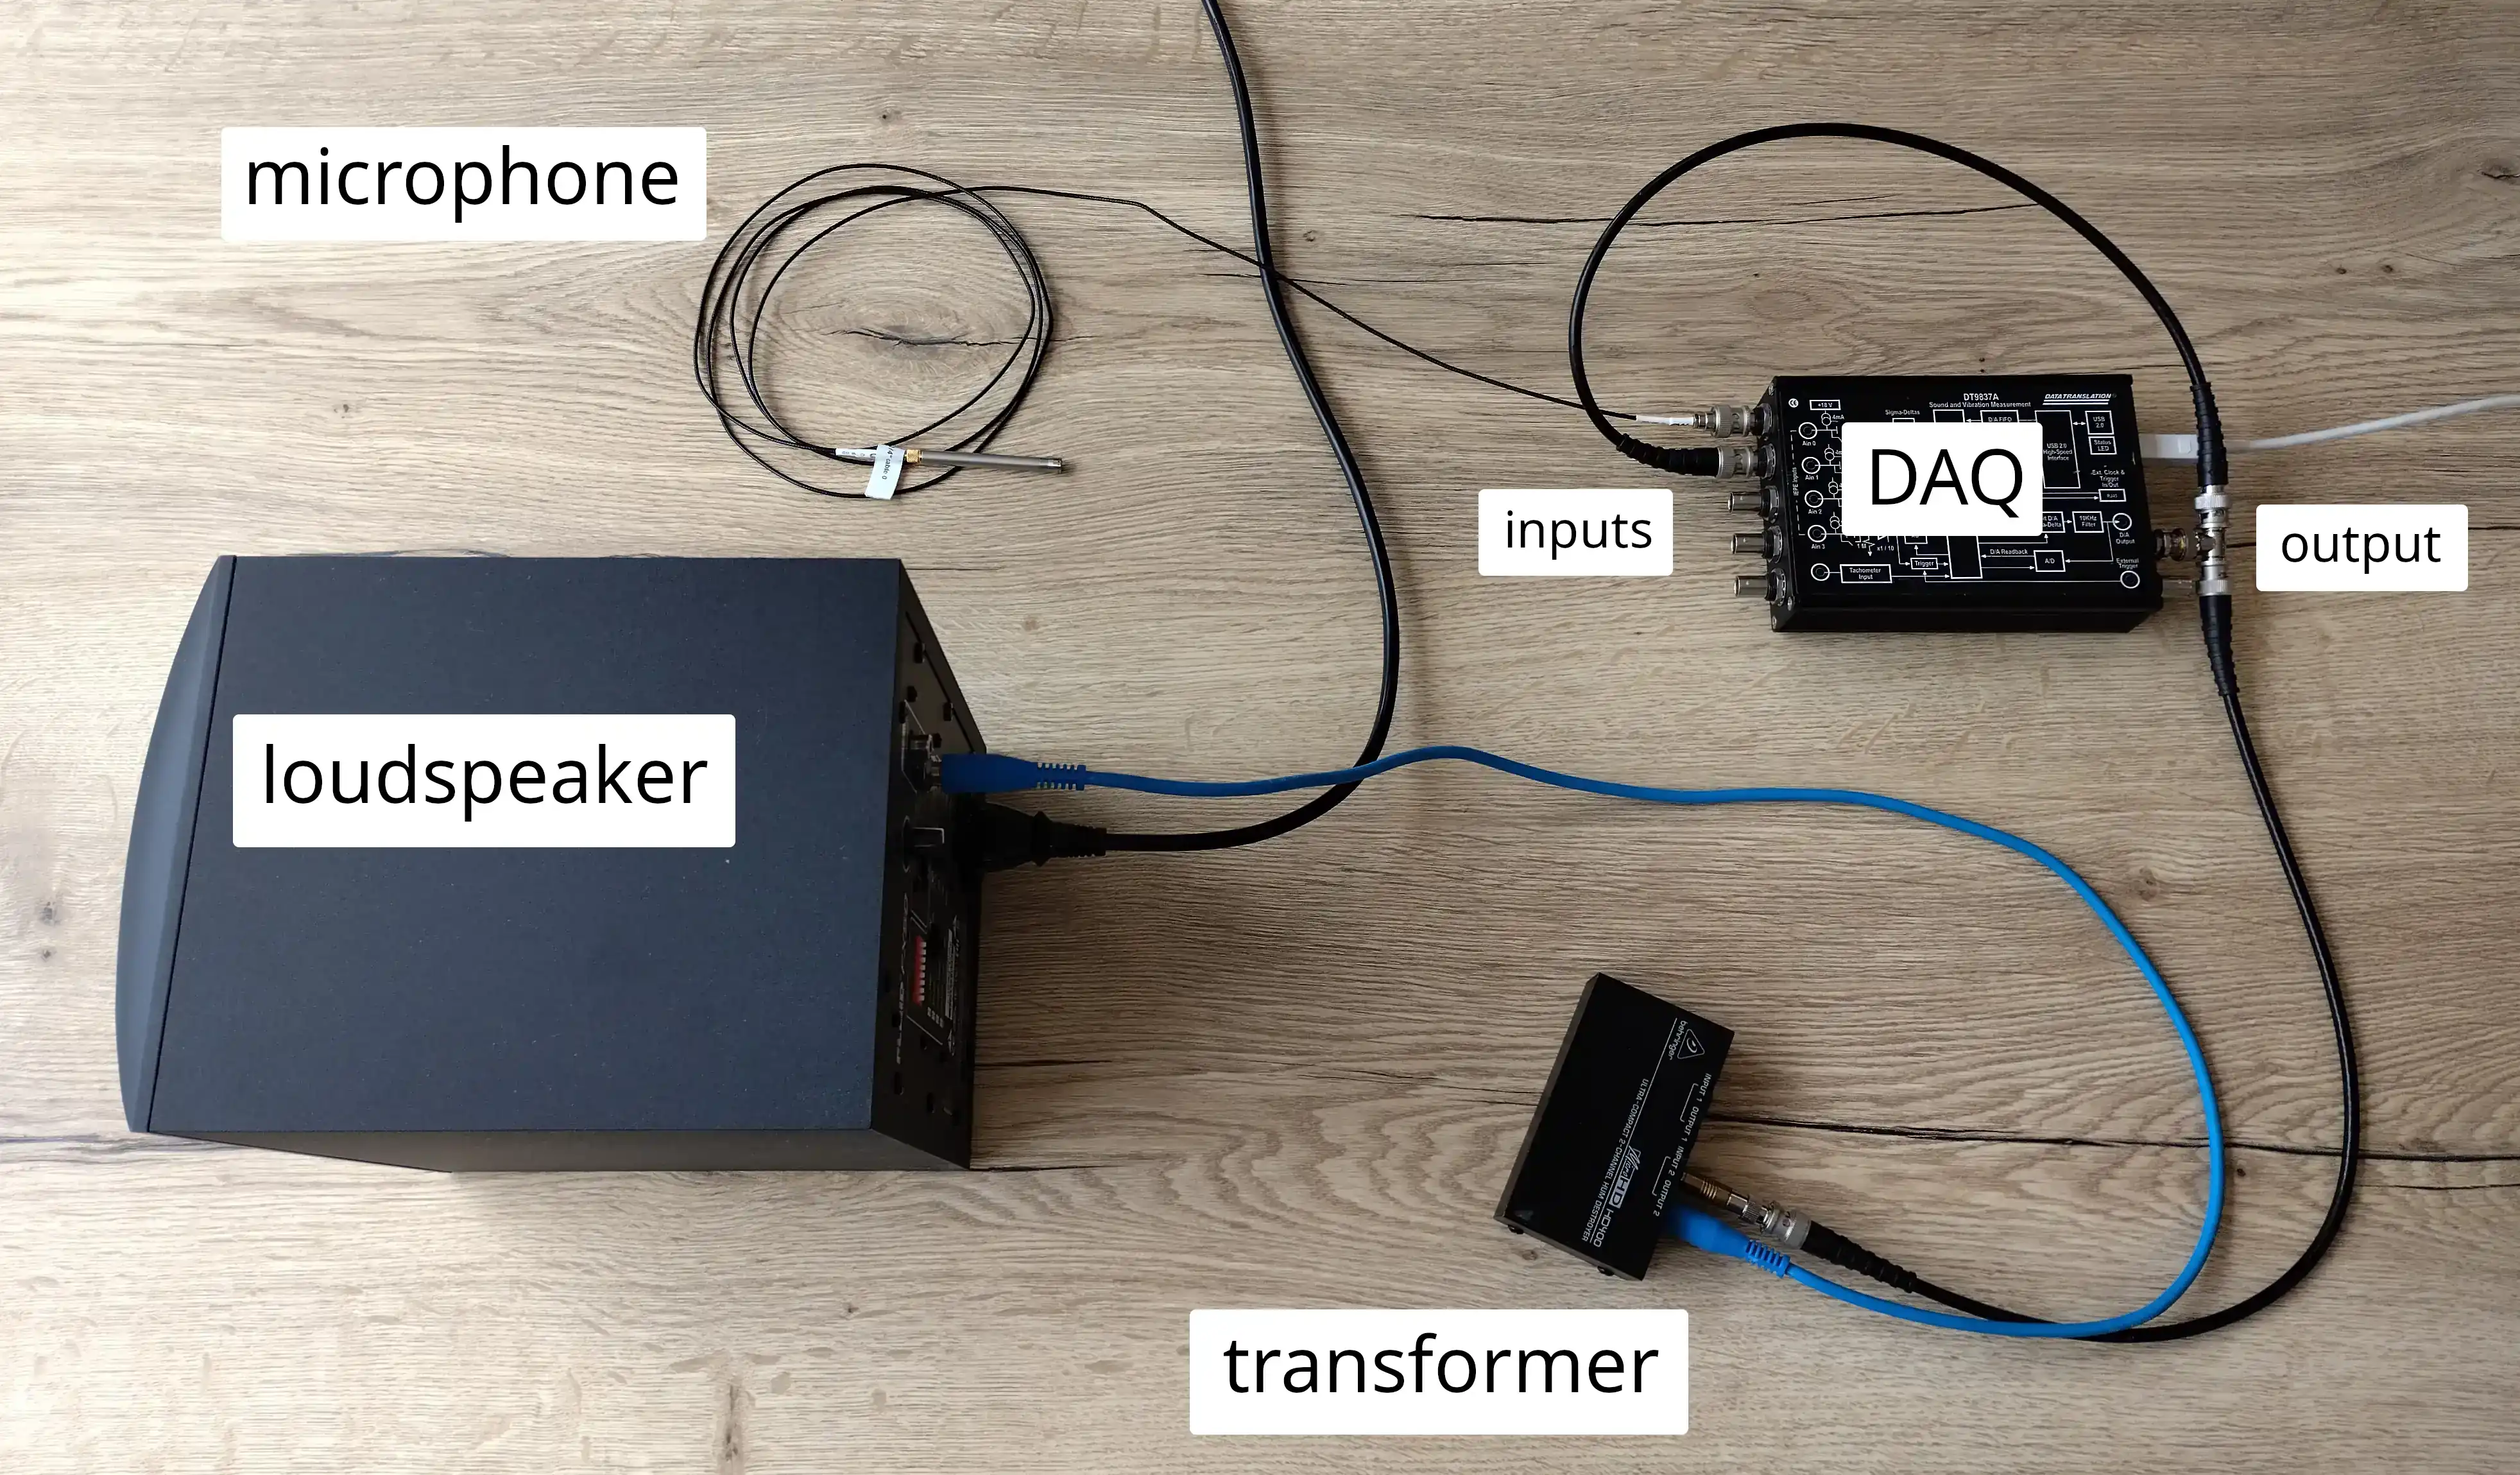
The microphone and loudspeaker are connected to a pc running ACME. The full setup looks like this:
Measurement setup
Located on the top right is the data acquisition (DAQ) device, which is the interface to our ACME software. The small black box on the bottom right is an isolation transformer. It breaks a ground loop: both the loudspeaker and pc are connected to safety earth.
Trick 1: Transfer magnitude
Our first trick for a good measurement, is to not only measure the signal from the microphone: I am going to measure the signal that is sent to the loudspeaker as well. You can see on the image above that the output signal is split and feeds directly back to the input. While this recorded output signal is supposed to be identical to the signal that ACME generates, there is a subtle difference. It contains the delay and frequency response aberrations of the DAQ. By taking the frequency response from this feedback to the microphone signal, ACME removes the delay and aberrations of the DAQ. It only costs one extra cable and one input channel.
Measurement
Performing the measurement itself is straightforward. ACME sends a pink noise signal the loudspeaker. The sound travels to the bottle, excites any resonances and is captured by the microphone. That signal is returned to ACME and recorded. I set the measurement length to ten seconds, which is more than long enough to average out noise in the DAQ and short enough not to bother me.
Trick 2: Insertion loss
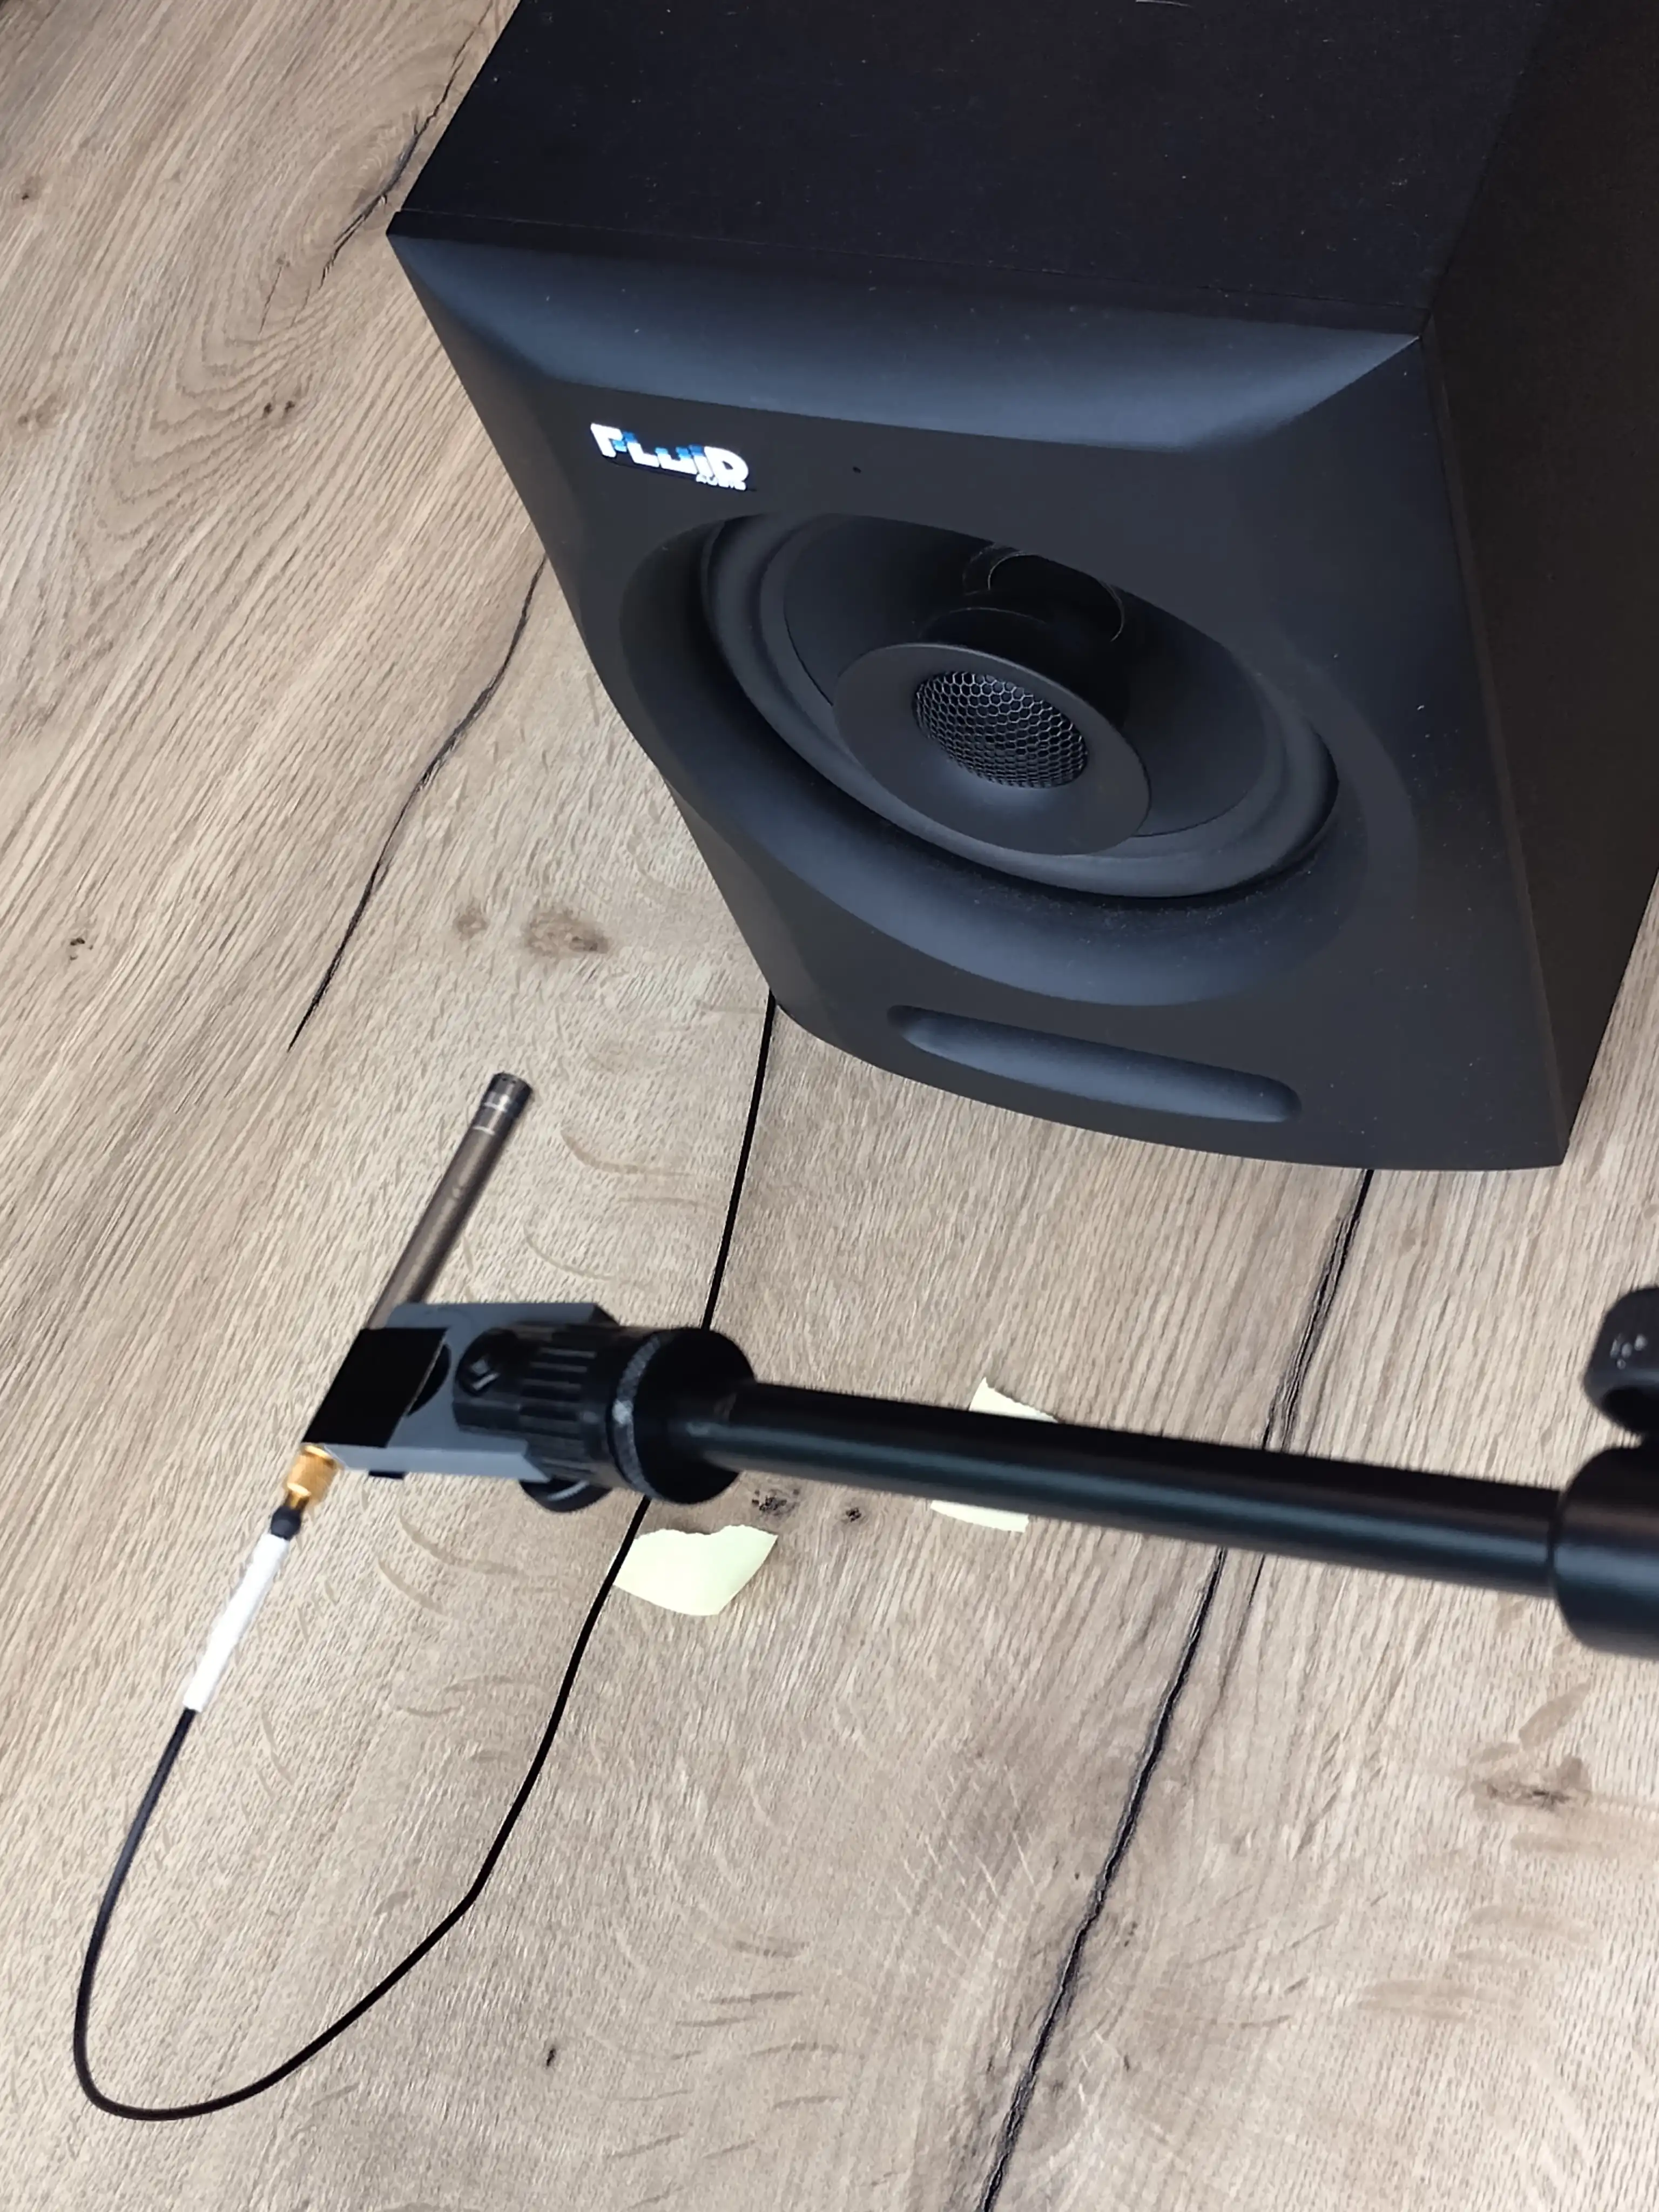
Taking the transfer magnitude corrects for irregularities in the DAQ, but not yet for the microphone, loudspeaker and isolation transformer. Our second trick cancels these out as well. This trick is to perform two measurements: first one without bottle, then one with bottle. We call the measurement without bottle the reference measurement:
Measurement setup for reference measurement
Perspective is a bit weird so here is another shot, this time with a bottle. The bottle is absent in the actual reference measurement.
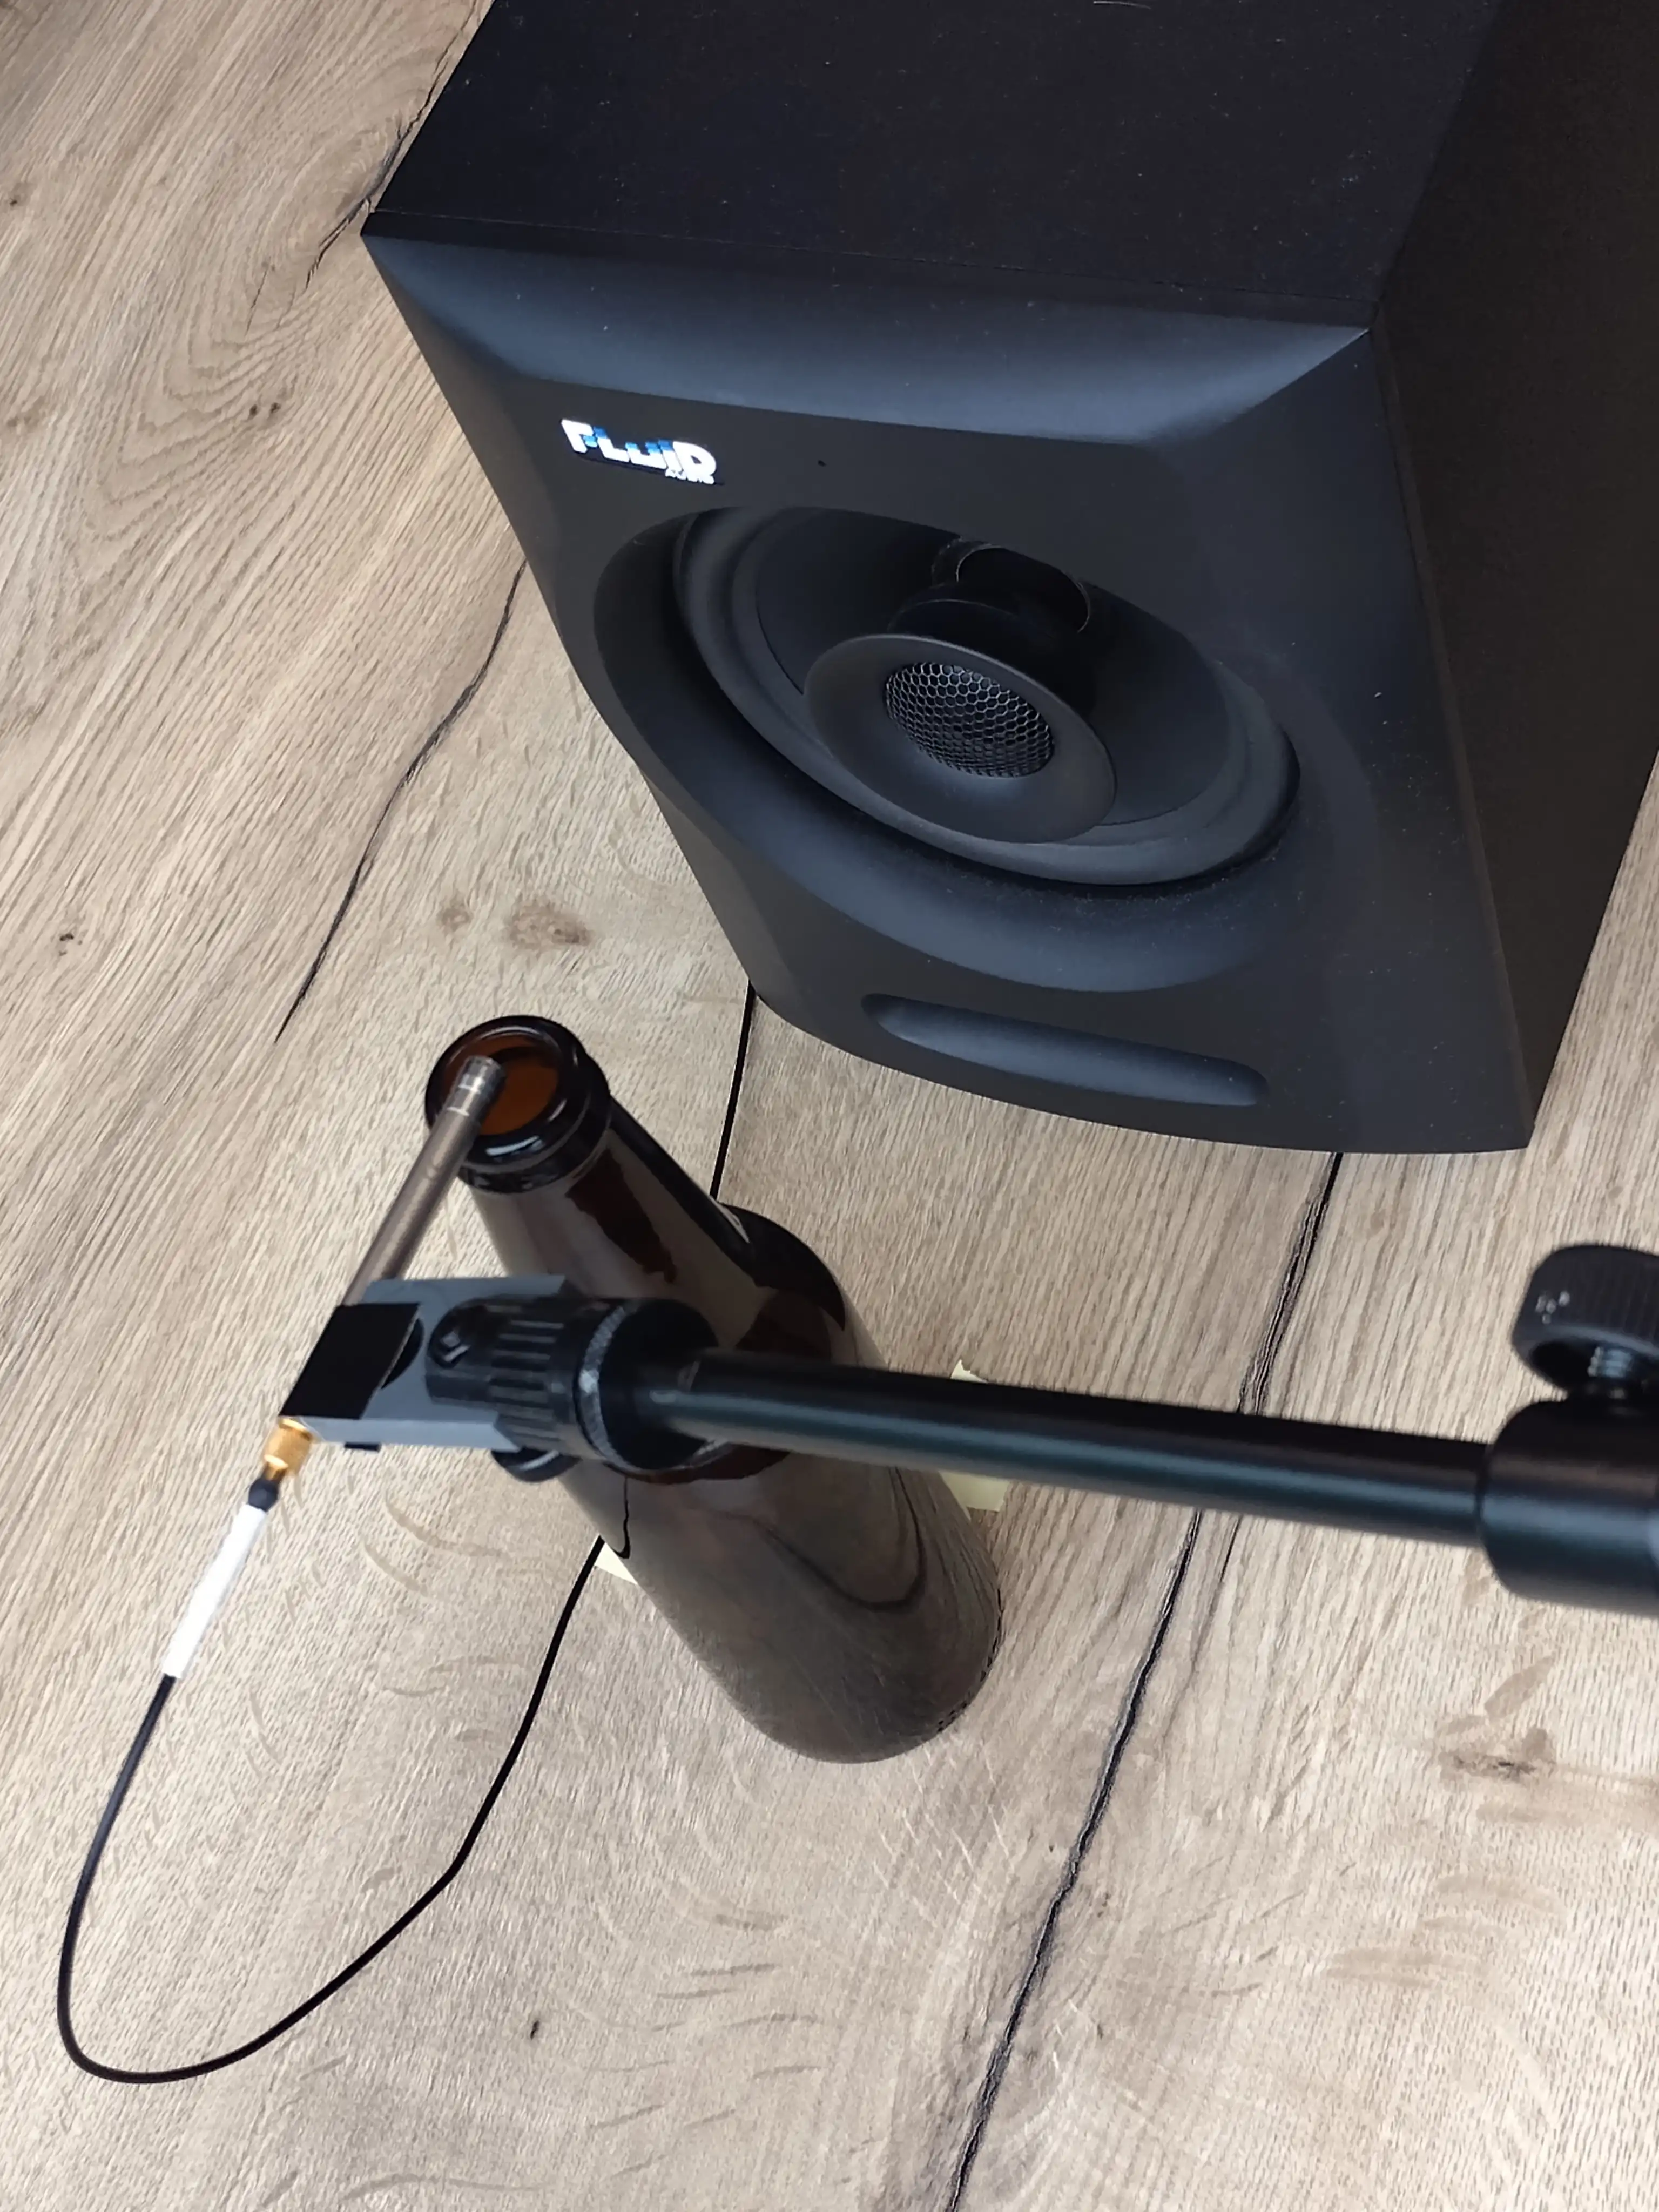
Bottle added for perspective, not present in actual measurement
By comparing the reference measurement to a measurement with the microphone inside the bottle, ACME can extract the effect of only the bottle. The effects of other components cancel out.
'Inserting' the bottle in the setup causes a 'loss' in frequency response magnitude, hence it is called insertion loss:
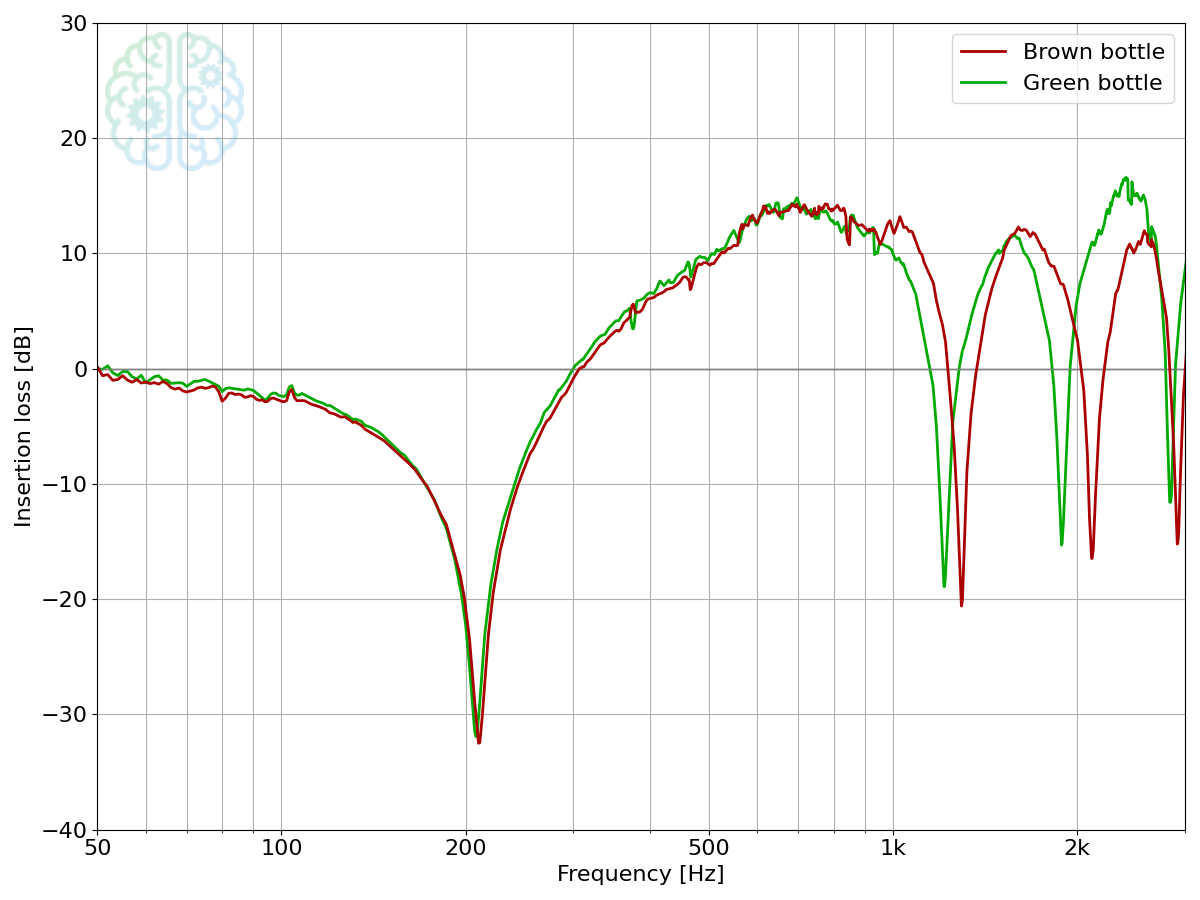
Resulting insertion loss
A positive loss means that the frequency response magnitude, and hence the sound pressure level at the microphone, has become lower. At around 210 Hz, the opposite happens: the sound gets louder. The air resonates and indicates that this is a resonance frequency of the bottle. Just above 1 kHz there is another insertion loss dip, pointing out another resonance frequency. This higher frequency corresponds to the higher tone you get if you blow really hard.
The first few tones of the two bottles are listed below, in Hz:
| Mode | Green | Brown | Difference (%) |
|---|---|---|---|
| 1 | 208 | 210 | +1 |
| 2 | 1208 | 1289 | +7 |
| 3 | 1880 | 2107 | +12 |
| 4 | 2833 | 2908 | +3 |
The lowest tone is nearly the same. It is only at the higher tones, that the different bottles show themselves. Try it, the next time you have a drink. It is possible to further tune the frequency, by not finishing the drink and leaving some beer in the bottle. We will cover that in a future blog post. Stay 'tuned'!